MonitorMe's Case Study
1. Introduction to MonitorMe
Distributed systems are prone to failures that can originate from
various sources such as microservices, the physical machines they
run on, or the networks that connect them. The ability to quickly
identify and rectify these problems is crucial for maintaining
system integrity and functionality. However, as these systems grow
in complexity and become more decentralized, pinpointing the exact
cause of a bug becomes increasingly challenging.
To aid developers in this complex environment, certain tools have
become invaluable. Distributed tracing, for instance, offers a way
to see how requests traverse through the system, providing insights
into where things might be going wrong. This does not always provide
an outright answer but significantly narrows down the possible areas
of concern.
In short, distributed systems sometimes fail. The problems might be:
- The code
- The machine it's on
- The network connection
1.1 What Developers Need?
In the complex world of distributed systems, developers face the
daunting task of identifying and fixing problems amidst the myriad
of components that make up modern applications. These systems,
characterized by their decentralized nature and reliance on
microservices, machines, and networks, demand tools that can cut
through the complexity and provide clear starting points for
troubleshooting.
The essential tools for debugging are:
- A single tool to tell them where to start looking
- A way to see how requests move through the system
-
Tools to understand the interaction between the front-end UI and
back-end services
With these tools, developers are better equipped to tackle the
challenges presented by the ever-evolving landscape of distributed
systems. Distributed tracing provides a macro view of request paths,
offering clues that can lead to the source of a problem, while
session recording delivers a micro view, allowing developers to
replicate and understand issues from the user's perspective.
Together, these tools form a comprehensive debugging toolkit that
addresses both the backend complexities and the nuances of front-end
interactions, making the troubleshooting process more efficient and
less time-consuming.
1.2 What MonitorMe Does?
Today more than ever reliable and efficient distributed systems are
crucial. Despite their complexity and the inevitability of failures,
developers need fast solutions for issue resolution. MonitorMe
offers essential tools to simplify and accelerate debugging in
modern applications.
MonitorMe's core features include:
-
Uses distributed tracing to show why a transaction went wrong
-
Combines with tools like session recording to speed up debugging
-
Helps developers fix problems faster, even though we can't
guarantee systems will always work as expected
MonitorMe is here to make the complex simple. It's built to help
developers spot issues quickly and get them fixed, using open
telemetry for the backend and Next.js for the frontend. It's about
helping you fix things faster, not making promises that everything
will always work perfectly.
2. Purpose and Overview
MonitorMe is a tool designed to simplify the task of monitoring
distributed systems. These systems can be complex, with many moving
parts like code, machines, and network connections. When something
goes wrong, it's tough to figure out where the problem is. That's
where MonitorMe comes in:
-
Simplifies Debugging: By showing how requests
move, it helps developers find problems faster.
-
Front-end and Back-end Integration: Works with
both user interfaces and server processes to cover all bases.
-
Speeds Up Solutions: Combines different tools to
help developers fix issues quickly.
MonitorMe is about turning the complex into the simple, using open
telemetry for the backend and Next.js for the frontend. It doesn't
promise perfection, but it does help you fix things faster.
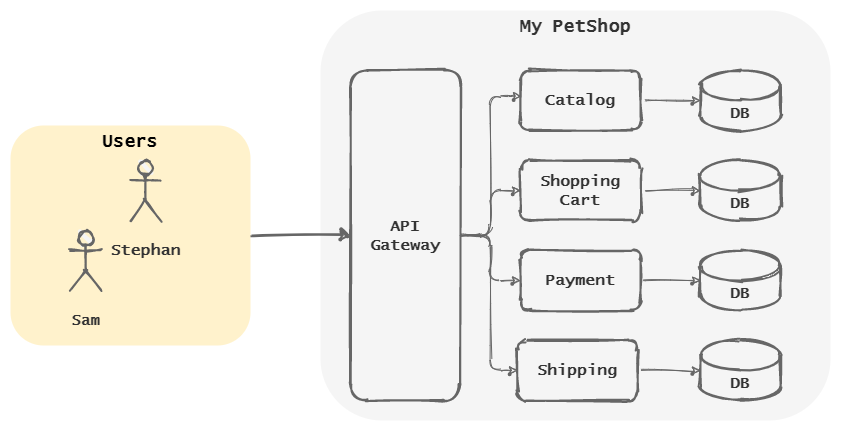
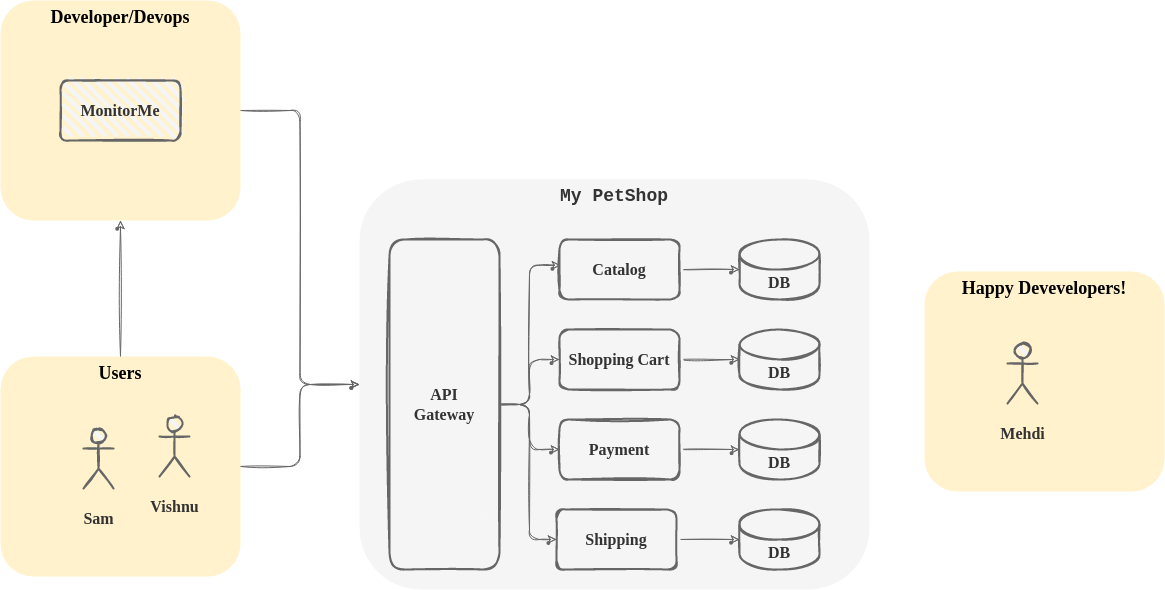
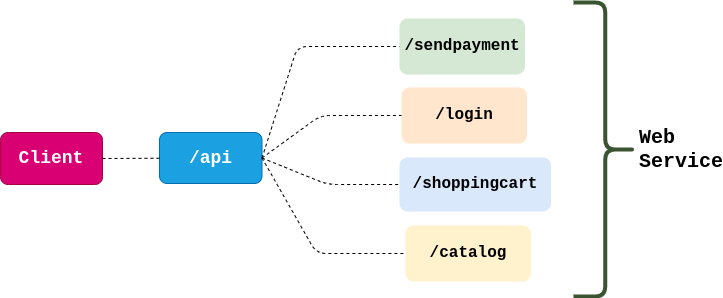
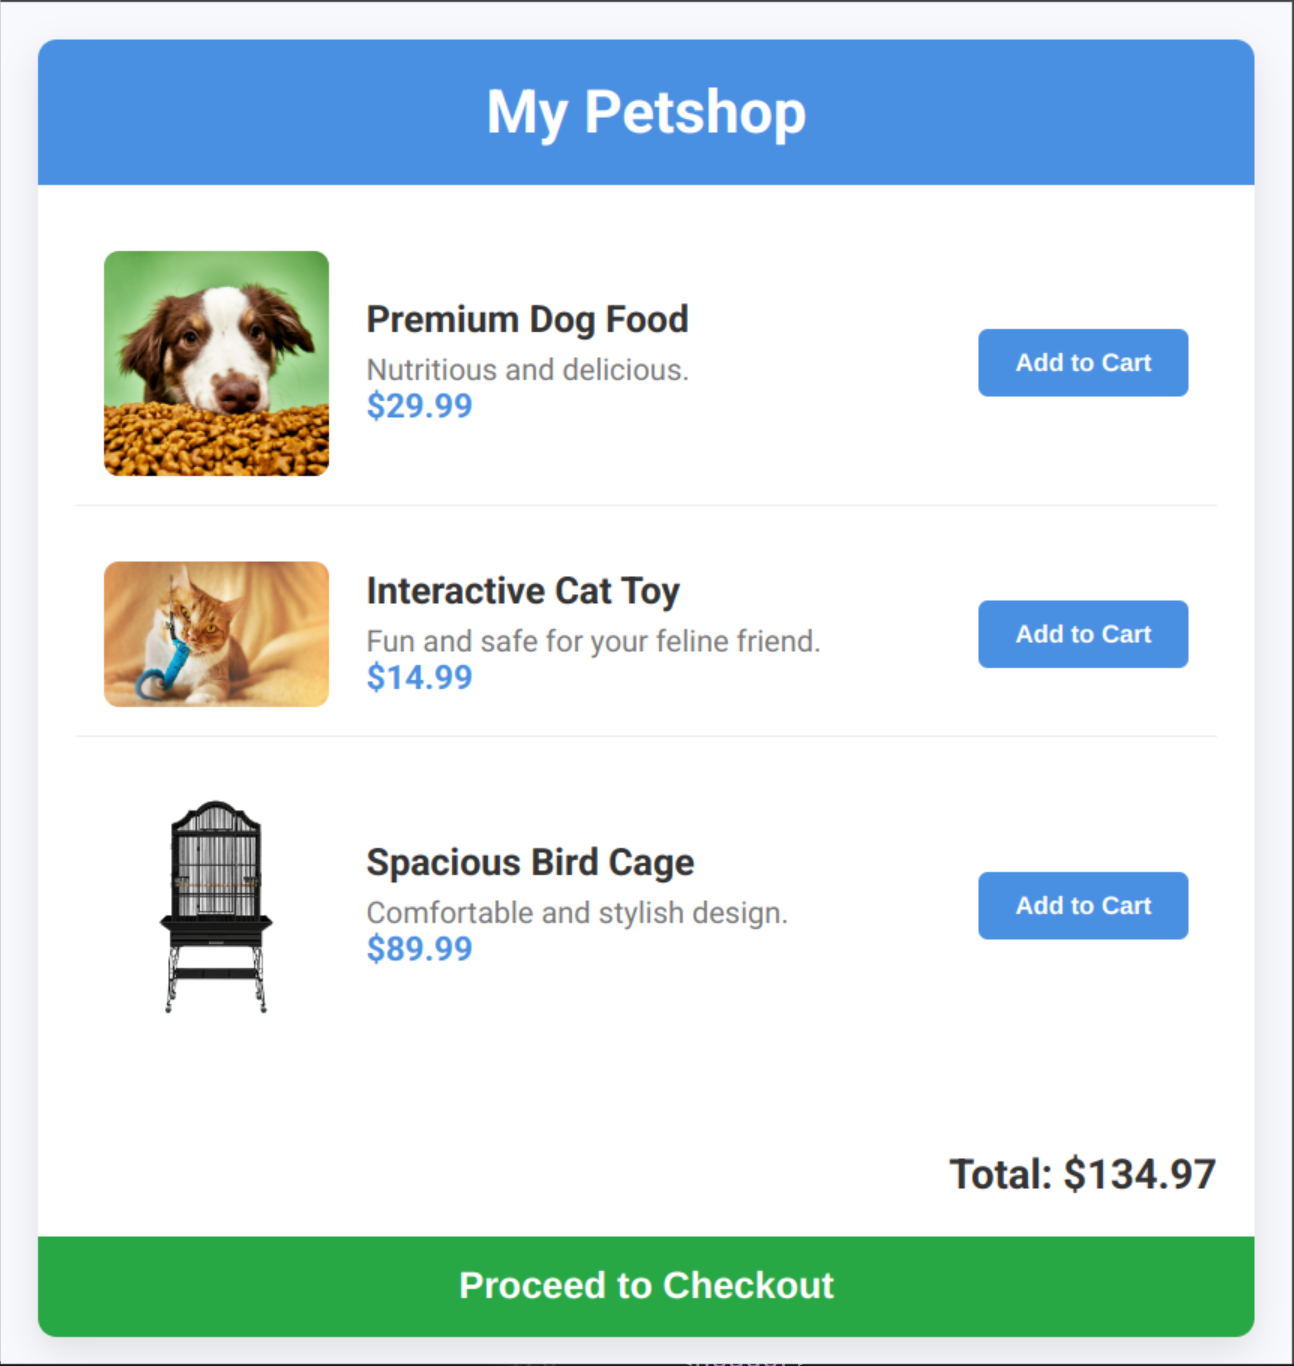
2.1 Real-World Example: My PetShop
Imagine running an online pet store called My PetShop, with various
services like user accounts, product catalogs, and payment
processing. Now, what if something goes wrong?
-
Problem: A customer can't check out their
shopping cart.
-
MonitorMe: You might spend hours or days trying
to find the bug across different services.
-
With MonitorMe: You can see exactly where the
request failed, be it the payment gateway or the catalog service.
-
Result: You fix the problem quickly, the customer
is happy, and the pet gets a new toy on time!
Here's how MonitorMe helps you move from frustration to fast fixes:
Before MonitorMe
Without MonitorMe, debugging is a slow and tedious process. You
spend hours cross-referencing logs and piecing together
information to pinpoint where things went wrong.
![]()
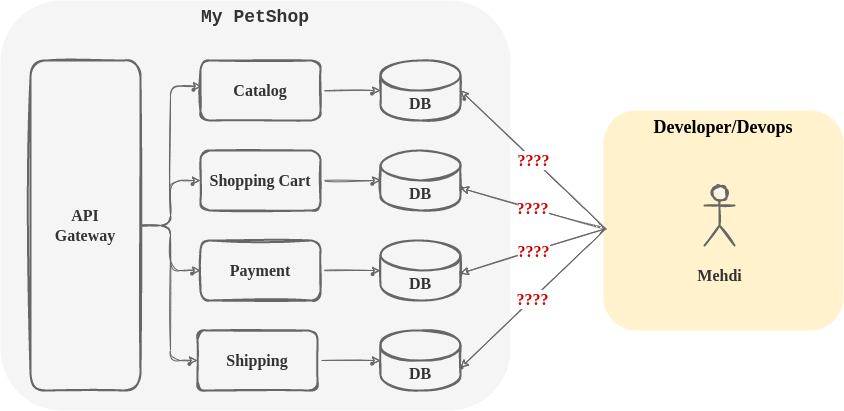
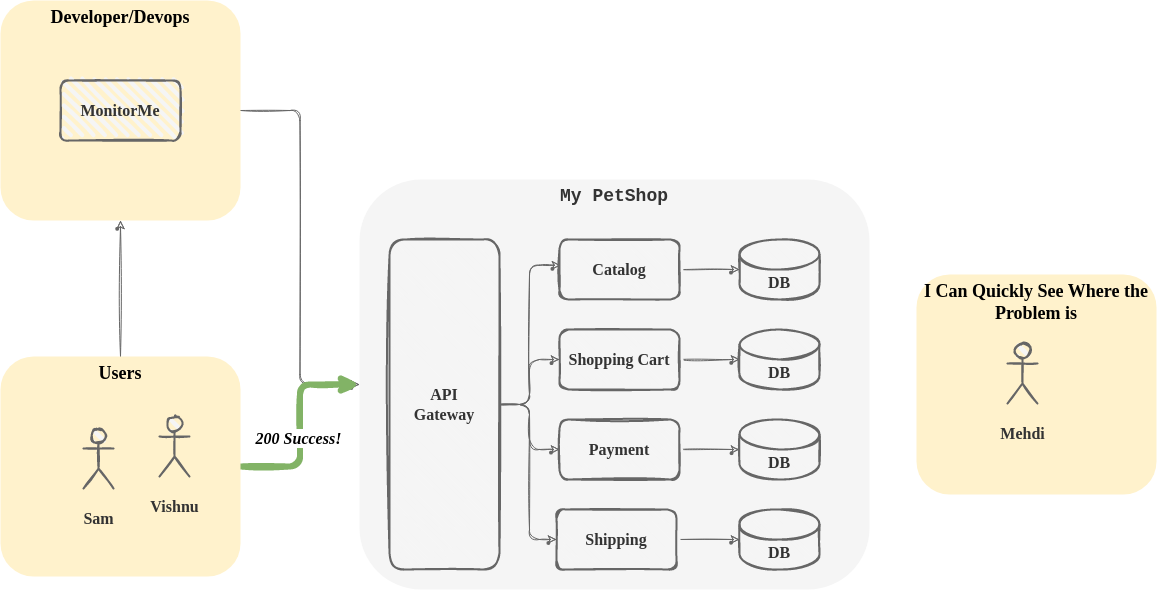
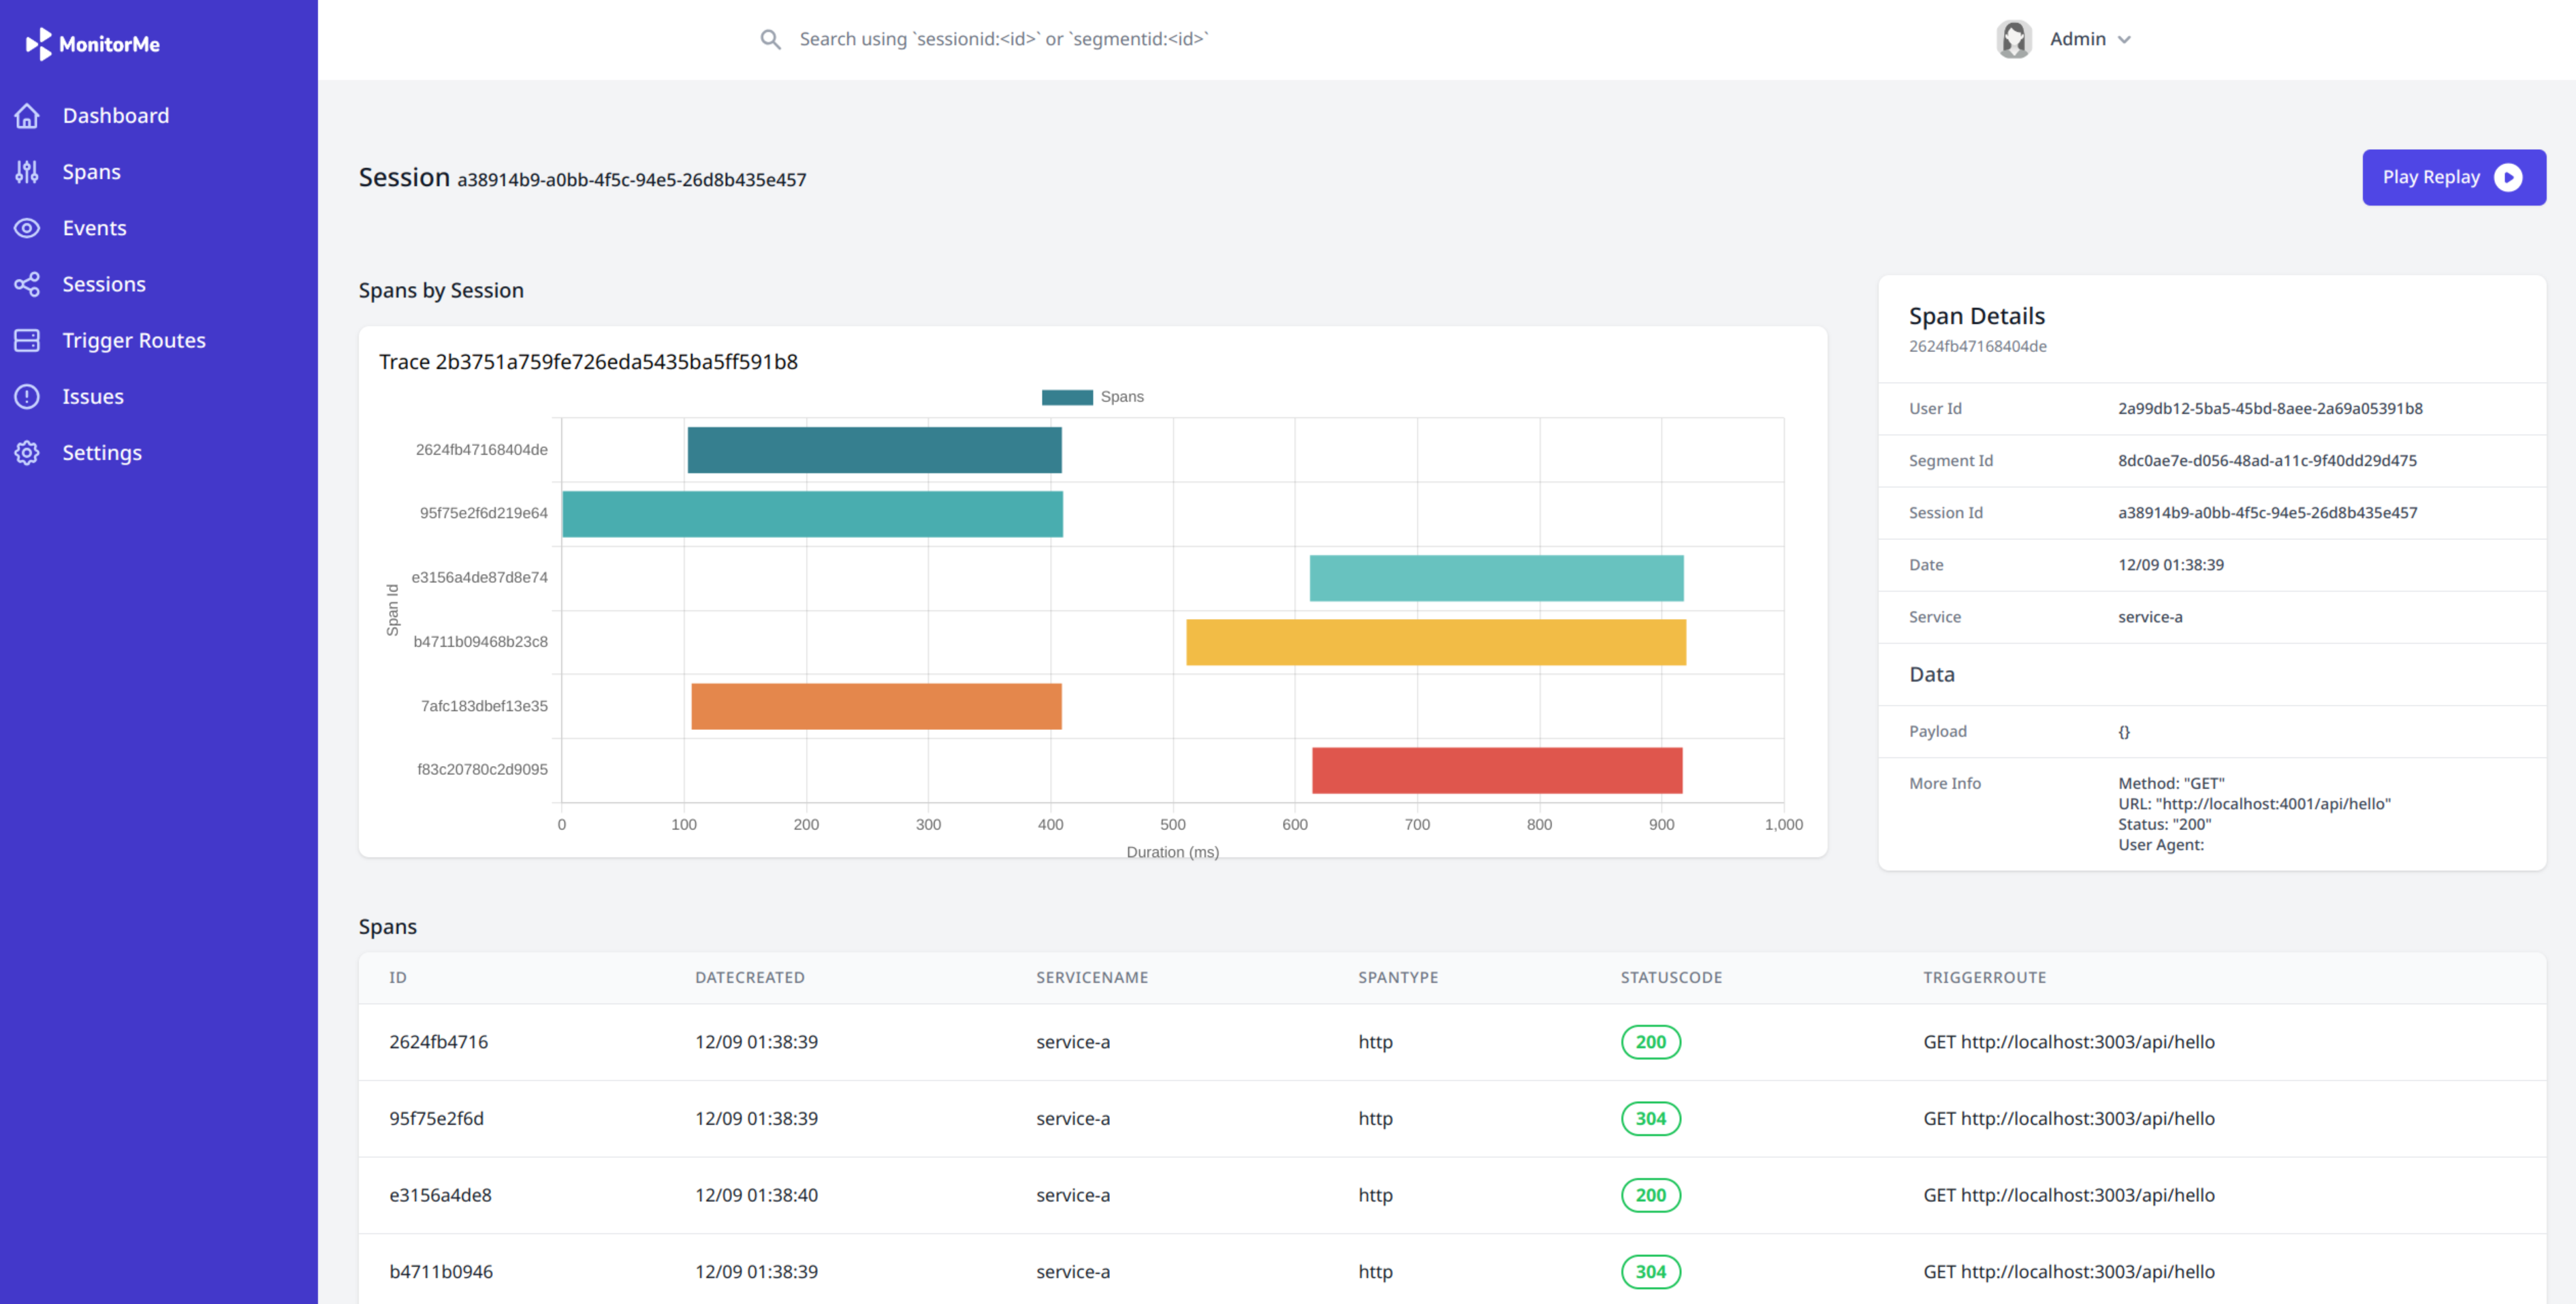
After MonitorMe
With MonitorMe, the problem is immediately clear. You can quickly
identify whether the failure lies within the payment gateway, the
catalog service, or elsewhere. The issue is resolved faster,
keeping customers happy.
![]()
My PetShop is just one example of how MonitorMe can turn a potential
crisis into a quick fix. It's a practical tool for anyone managing
complex systems and wanting to keep things running smoothly.
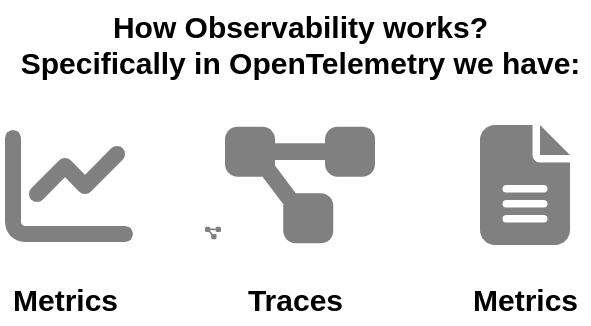
3. Understanding Observability
Observability isn't just a buzzword; it's a vital part of
maintaining and understanding complex systems. Here's what it
involves:
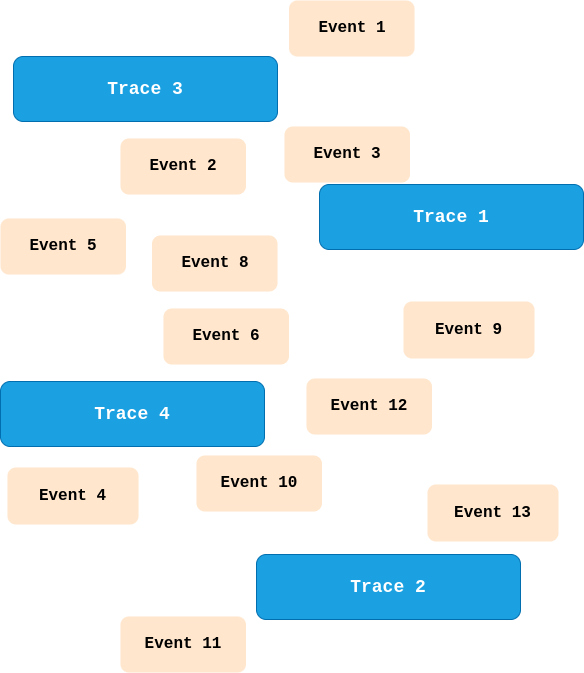
3.1 Tracing
Tracing helps track a request as it moves through the different
parts of a system. If something goes wrong, tracing shows where it
happened, like a detective following clues. It helps in:
- Finding where errors occur
- Understanding performance bottlenecks
In other words, tracing helps track a request as it moves through
the different parts of a system. Imagine a package being sent from
one city to another, stopping at various places along the way.
Trace: This is like the entire journey of the
package, from start to finish. It's the big picture of what
happened.
Span: Think of a span as one stop or part of the
journey, like going from one city to the next. Each span has a
beginning and an end.
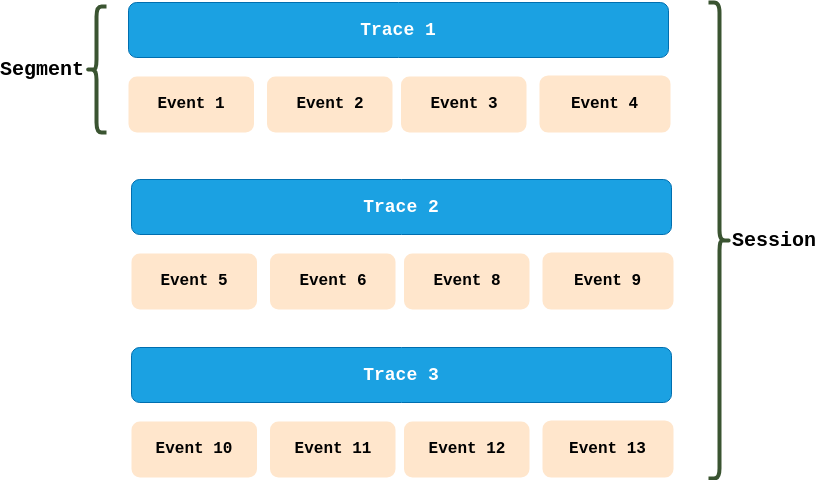
Relationship: The trace is made up of many spans,
just like a journey is made up of many stops. You can see where
time was spent, what went smoothly, and where there were delays.
In simple terms:
- Tracing shows you the whole story.
- Spans are the chapters of that story.
This helps in:
- Finding where errors occur.
- Understanding performance bottlenecks.
3.2 Metrics
Metrics are the numbers and stats that tell you how your system is
doing. They're like the vital signs for your application:
- How fast is it responding?
- How many users are online?
- Is there any part that's struggling to keep up?
3.3 Logging
Logging is the act of recording what's happening in your system.
Think of it as a journal of diary for your application:
- What actions are users taking?
- Are there any warnings or errors to note?
-
Logs help in troubleshooting and understanding user behavior
3.4 Real-World Example: My Petshop
Just like in our previous example, observability plays a crucial
role in managing an online pet store:
-
Tracing: Finding out why a pet food order got
delayed
-
Metrics: Monitoring how many users are browsing
cat toys
-
Logging: Keeping track of failed login attempts,
which might indicate a security concern
Observability, through tracing, metrics, and logging, allows
developers to see inside their systems. It's like having x-ray
vision for your application. With tools like MonitorMe, this vital
insight is just a click away, helping you keep everything running
smoothly.
Observability provides invaluable insights into how requests are
processed, whether they succeed or fail. For instance, when a
request is successfully handled, traces highlight the seamless
interaction between services, showcasing dependencies and response
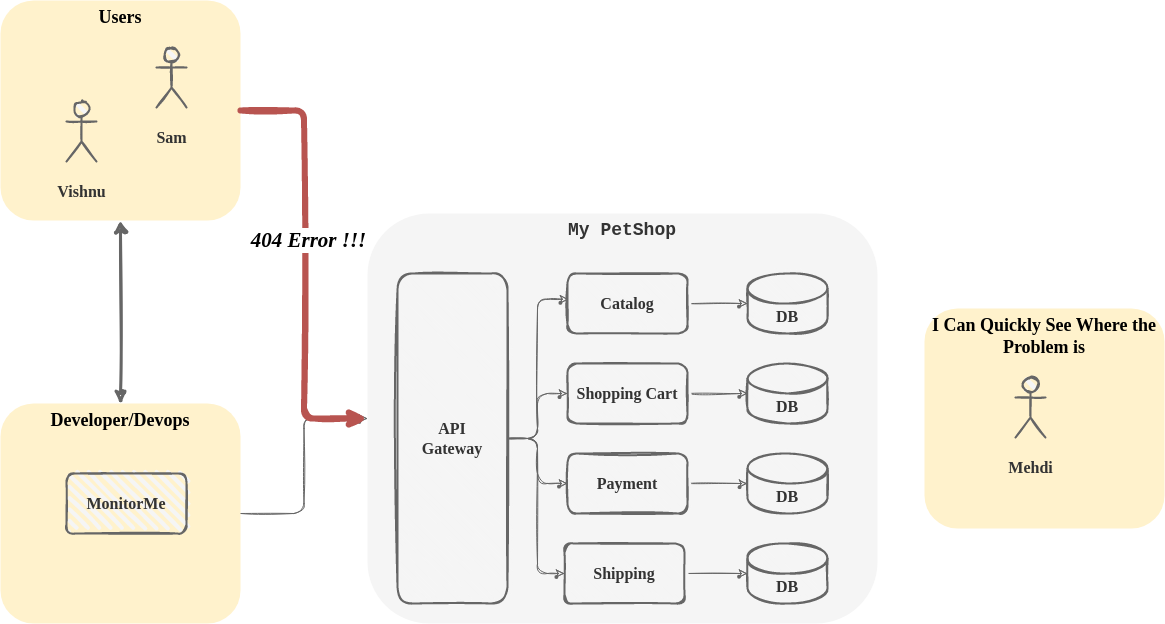
times. Conversely, when a failure occurs, traces help identify the
bottlenecks or misconfigurations, such as missing data or incorrect
routing, enabling faster resolution.
Even in scenarios where a requested resource is not found, traces
reveal the path taken by the request, clarifying where and why the
issue arose. This visibility ensures developers can address
potential gaps and maintain system reliability.
4. Current Landscape and Solutions
Bob is looking for ways to achieve observability for his
application. Various solutions are available, each with its own
benefits and challenges. Here's an overview of the different paths
he can take:
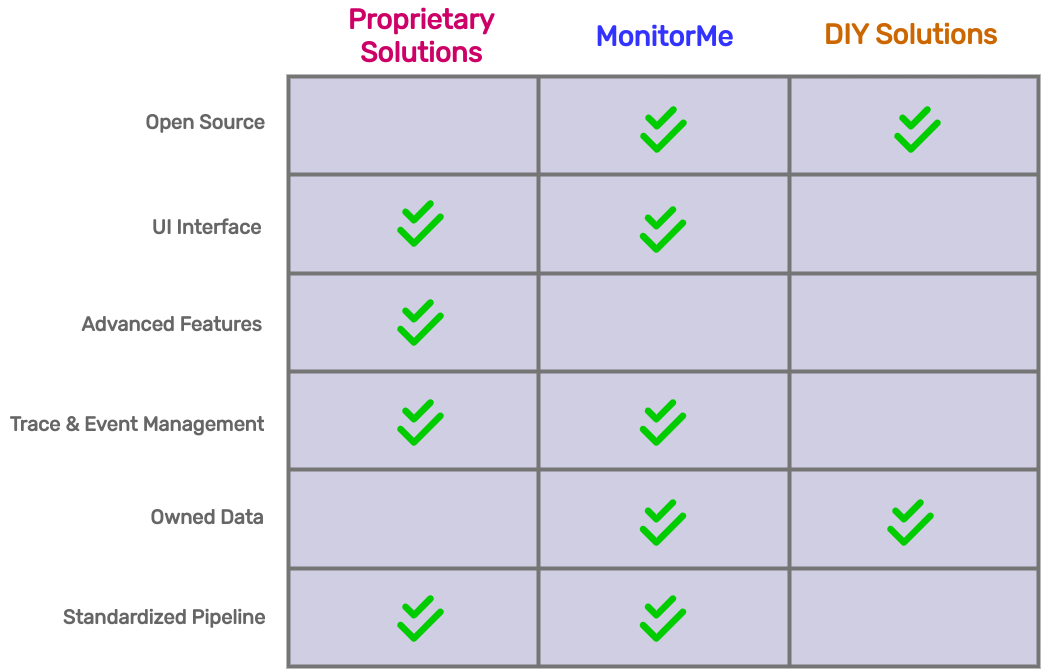
4.1 Enterprise Solutions
-
Vendors like Sentry, Datadog, New Relic: Provide
observability for traces, logs, metrics.
- Feature-rich: Everything in one package.
-
Downsides: Lack of data ownership, recurring
fees. May not suit small companies with limited budgets.
4.2 The Ideal Solution: MonitorMe
-
Ease of Enterprise: Ready-made pipeline for ease
of deployment.
-
Benefits of DIY: User retains data ownership,
suitable for small microservice-based applications.
-
Focused on Context: Helps you figure out where to
investigate, without unnecessary extras.
The current landscape offers various paths, from all-in-one
enterprise solutions to DIY options. MonitorMe stands out as a
middle ground, combining the ease of ready-made tools with the
ownership and focus of open source. It provides the necessary
context without overloading you with extras, helping you target your
investigations efficiently.
Our Solution: MonitorMe
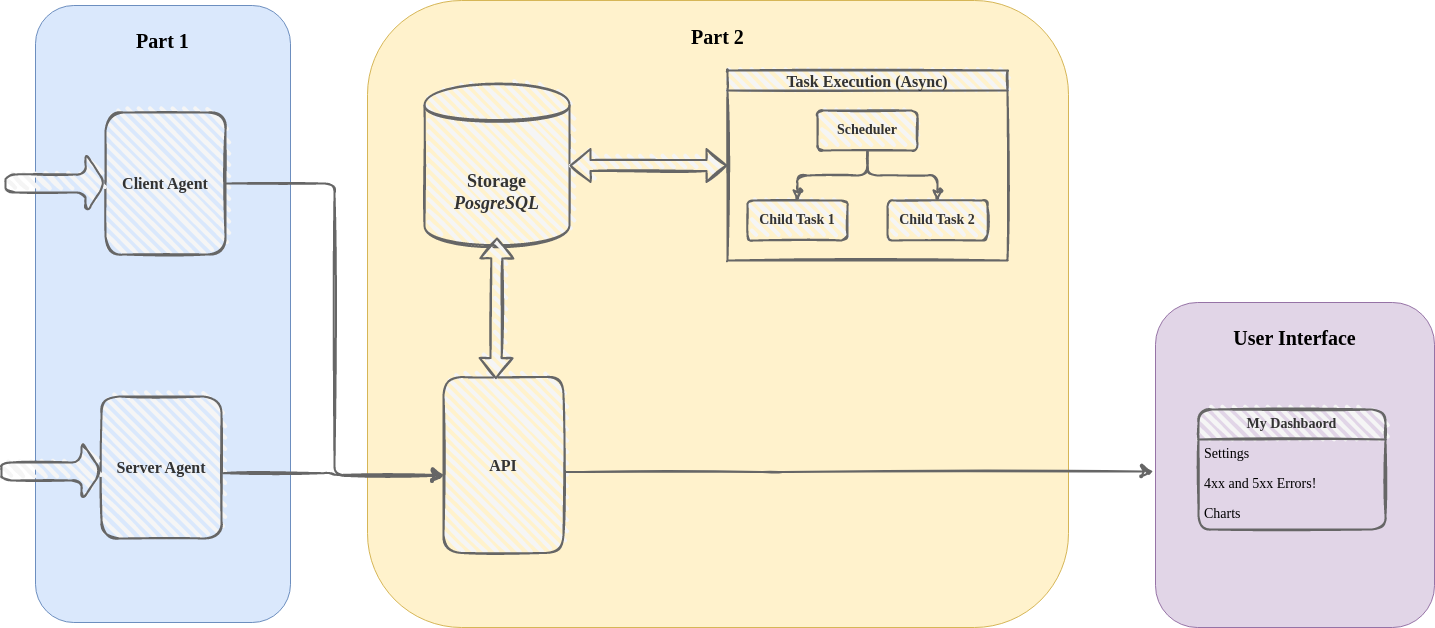
5.1 Acquiring Data from Source
MonitorMe is designed as a full-stack tracing tool to monitor small
microservice-based applications. The acquisition of data is a
two-fold process that includes both client and server agents.
Client Agent
The Client Agent is designed to enhance website monitoring and
debugging capabilities through the following methods:
-
Utilizes an open-source web session recording library to collect
event data from the user's browser.
-
Periodically takes snapshots of the entire DOM and serializes the
data for storage.
-
Asynchronous processing to minimize CPU time and selectively
records events to manage volume.
Server Agent
The Server Agent leverages advanced monitoring techniques to ensure
comprehensive visibility into application performance, characterized
by:
-
Uses the open-source observability framework, OpenTelemetry, with
custom modifications to gather span data from instrumented
applications.
-
Works through context propagation, associating spans with their
traces, and traces with their corresponding sessions.
-
Chosen for its Node.js SDK with automated instrumentation,
requiring no code changes, and best suited for those without time
to manually instrument every microservice.
5.2 Advanced Insights into MonitorMe
For those looking to dive deeper into the architecture, MonitorMe integrates intelligent agents with
existing applications to enable automated tracing. Traces are collected in a sparse but efficient
manner, ensuring only meaningful events are captured, which reduces overhead while maintaining
critical insights.
Custom Span Processors play a pivotal role in enhancing the metadata associated with each span's context
object. This ensures that all relevant information is available for troubleshooting and analysis.
Additionally, the relationship between traces and spans is seamlessly established, offering a clear
visualization of the interactions within a distributed system.
By leveraging OpenTelemetry, MonitorMe enhances flexibility and ensures seamless integration with
existing codebases, delivering an efficient and robust solution for monitoring and debugging
microservice-based applications.
5.3 Processing and Displaying Information
The key components for processing and displaying the information
include the API server, a PostgreSQL database instance, and a
Real-Time Processing Engine.
API Server
The API Server plays a crucial role in data management and
accessibility, performing the following functions:
-
Receives data from the agents and transforms it for efficient
querying.
-
Serves the transformed data to the user interface through SQL
queries.
PostgreSQL Database
The PostgreSQL Database is central to MonitorMe's data handling
strategy, offering key advantages:
-
Acts as the primary datastore, chosen for its robustness and
flexibility.
-
Handles a high volume of events gathered by MonitorMe from the
instrumented application.
Real-Time Processing Engine
The Real-Time Processing Engine is essential for maintaining the
immediacy and relevance of data, equipped to perform:
- Manages real-time data transformation and enhancement.
-
Handles challenges related to metadata propagation with
OpenTelemetry by processing and attaching necessary metadata.
-
Provides capabilities for handling additional real-time analytics
and processing functions, enabling more dynamic and interactive
user experiences.
This configuration leverages the strengths of PostgreSQL and
real-time processing to provide an efficient, responsive system for
processing and displaying information within MonitorMe. This design
ensures that information is made readily available for debugging and
monitoring small microservice-based applications.
MonitorMe is designed as a full-stack tracing tool to monitor small
microservice-based applications. The acquisition of data is a
two-fold process that includes both client and server agents.
5.4 Customizing Views
MonitorMe's user interface (UI) has been thoughtfully designed to
strike the right balance between ease-of-use and functionality. Our
development decisions have been guided by real-world testing,
including the following aspects:
Simplicity and Power
MonitorMe combines an intuitive interface with robust capabilities, empowering users to quickly
navigate complex datasets while maintaining a clear and clutter-free experience. Whether you're
diagnosing errors metrics, the balance between simplicity and power ensures
that both novice and expert users can seamlessly achieve their goals.
Practical Experience
Our approach to development is grounded in practical experience,
focusing on:
-
Real-world Testing: By developing and testing
within actual microservice-based applications, we've ensured
real-world applicability.
-
Error Handling: We've carefully considered how to
represent errors and how users might need to interact with them.
Community Input
Incorporating feedback is key to our development process,
highlighted by:
-
Professional Consultation: We sought input from
working developers to refine the UI's functionality.
-
Needs Analysis: Our interface is designed with
the features that professionals in the field find essential and
practical.
While MonitorMe's UI might not have all the features found in some
larger enterprise solutions, our focus is on providing effective and
engaging tools for tracing your microservices. We aim to offer a
streamlined, fun, and intuitive experience that focuses on what
truly matters in understanding and managing your microservice
architecture.
Challenges and Solutions
6.1 Integration with OpenTelemetry
Integrating OpenTelemetry with rrweb was a significant technical
challenge. The incompatibility between rrweb's event streams and
OpenTelemetry's context object required us to devise unique ways to
bridge the two.
Creating Context
We created and attached contextual information to organize data by
time, user ID, and session ID, helping identify the events and
traces associated with a particular user session. Session IDs: A
unique session identifier was created and linked to the back-end
requests. A Custom Span Processor and custom middleware were
employed to efficiently attach these IDs.
Custom Span Processor & Middleware
We overrode the default span processor to attach specific metadata,
including trigger_route, user_id, session_id, and request_data. This
allowed us to correctly align the events and spans.
Solutions to Database Challenges
We had to find solutions for database spans losing context in
certain Node versions, which led to additional adjustments in data
handling.
6.2 Comprehending Data Flows
Understanding and managing data flows was another complex aspect,
involving decisions about data storage, query capabilities, write
volume, and scalability.
Database Selection
The structured, relational nature of our data made traditional
relational databases unsuitable. MongoDB's write times were
appealing but fell short in querying large amounts of documents.
Cassandra was chosen for its excellent handling of high-write
scenarios and scalability.
High Write Volume
A high-performant message queuing system was needed to support very
high write speeds, crucial for handling a vast amount of
user-created events.
Scaling Options
The database cluster needed to have expansion options to support
future growth. Cassandra's linear scaling and built-in data
partitioning made it the perfect fit for our needs.
6.3 Navigating UX Design Decisions
The design of MonitorMe's user interface had to align with the goal
of simplicity while providing the essential features needed for
debugging.
Minimum Necessary Features
To make the tool as simple as possible, we offered only the critical
features, omitting user experience analytics, back-end metrics, and
alerting functions.
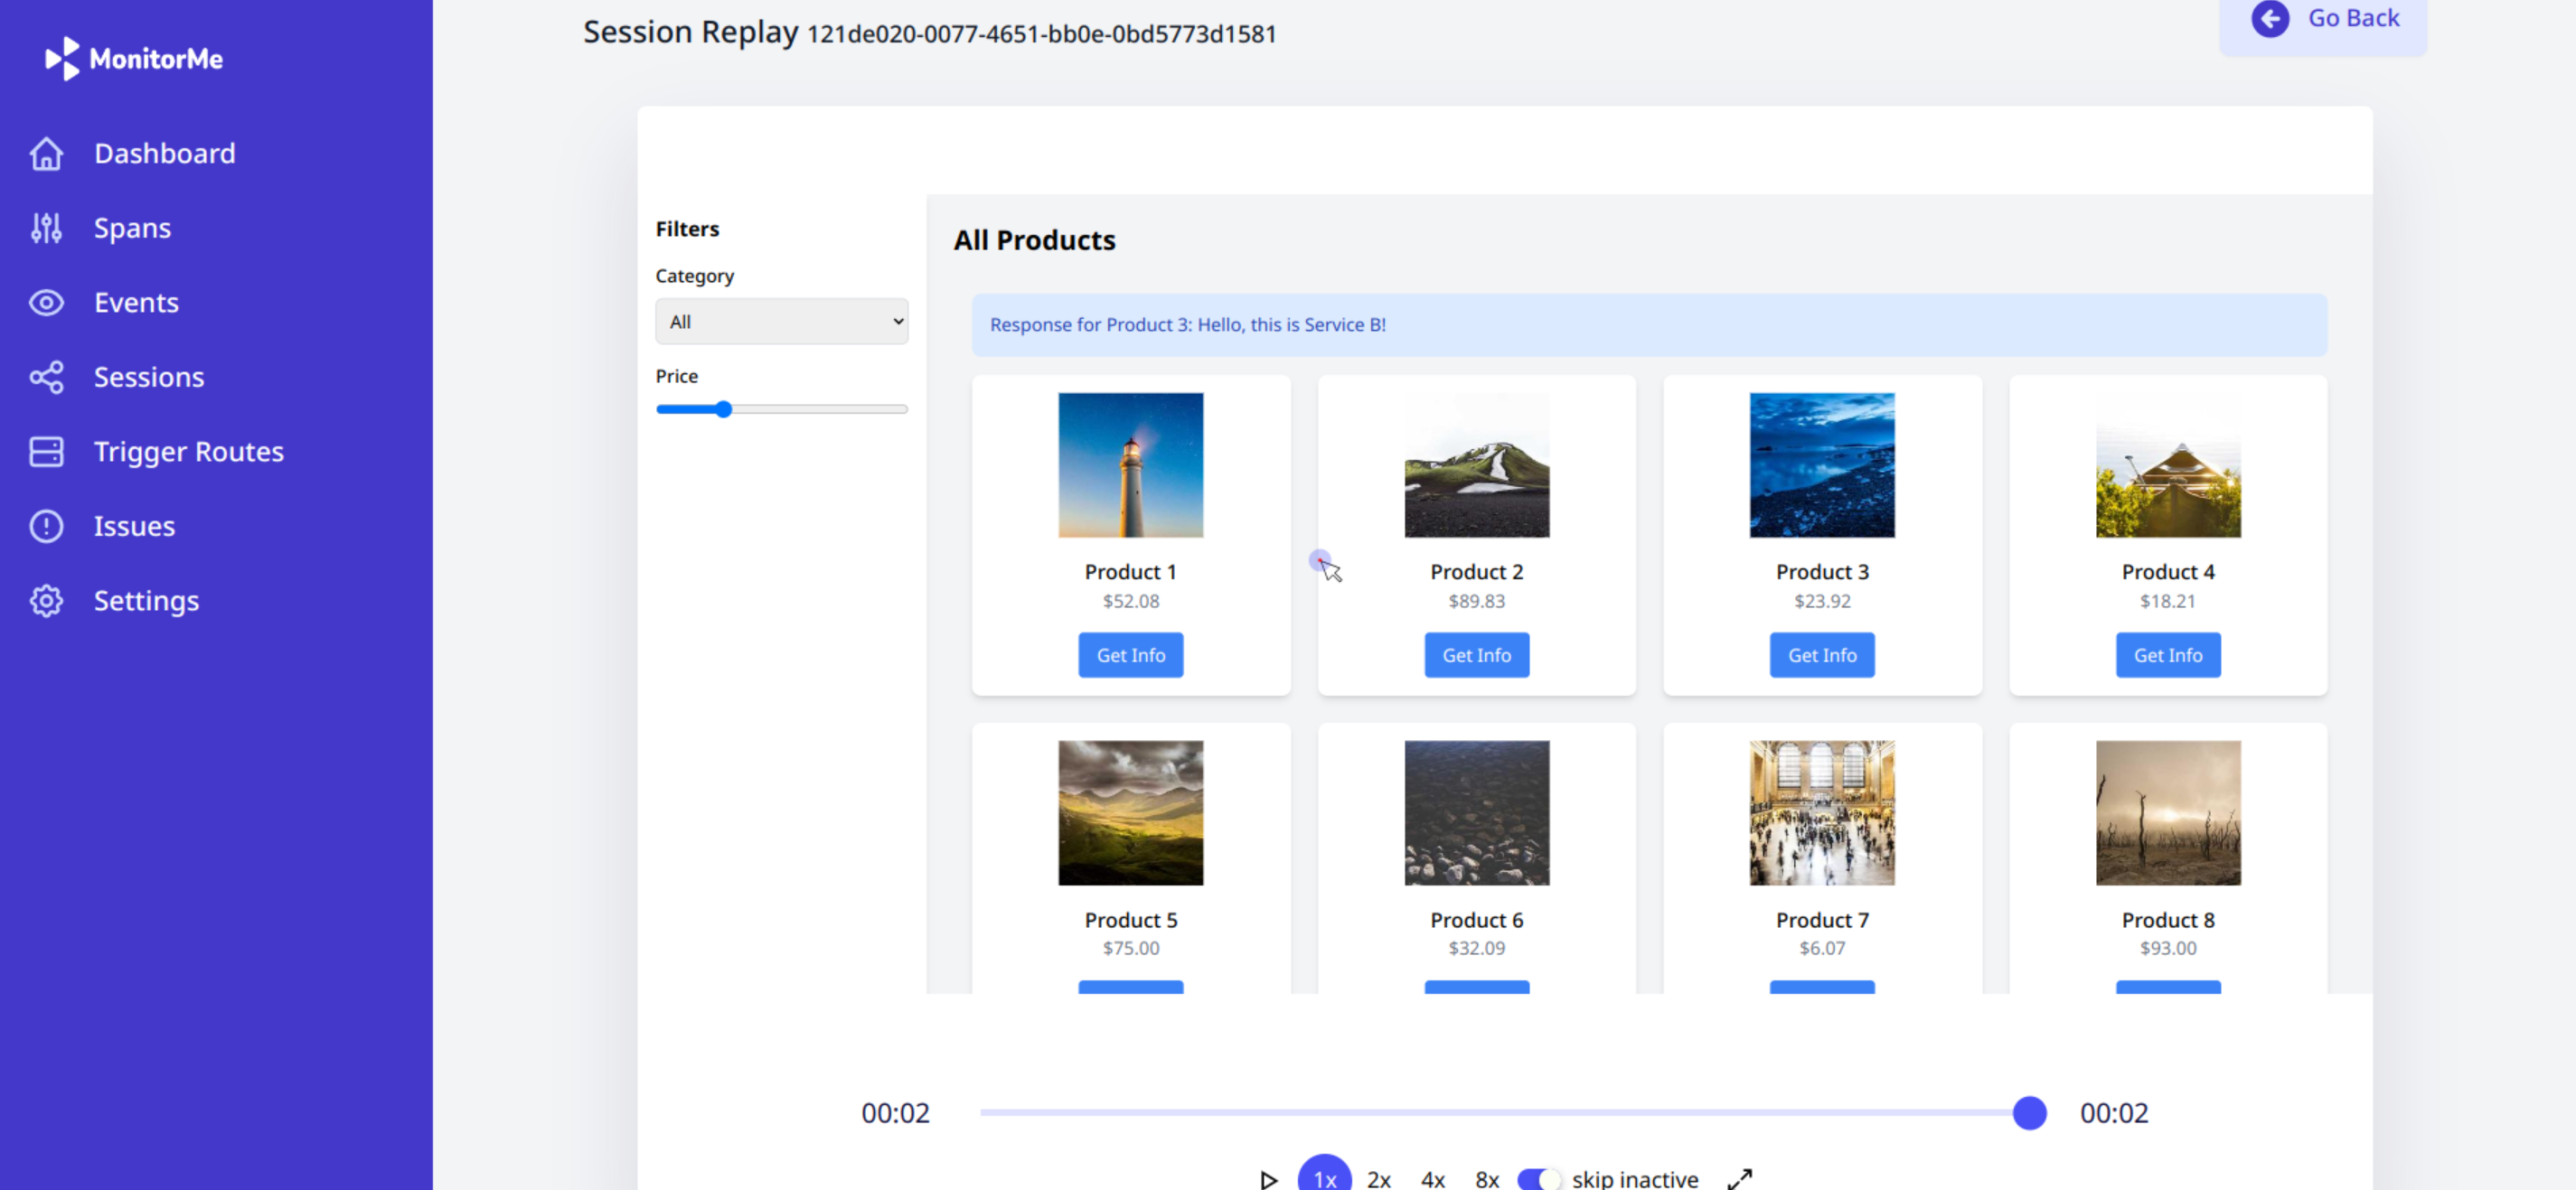
Session Replay Inclusion
One non-traditional feature included was session replay. Though not
standard in tracing, it was considered essential for the debugging
process.
Consulting Software Engineers
To ensure maximum utility, we engaged working software engineers in
the design process, focusing on providing a user-friendly interface
with clear and relevant information.
Conclusion
The development of the MonitorMe app was filled with intricate
challenges that required innovative solutions and thoughtful
decision-making. Integrating disparate tools like rrweb and
OpenTelemetry necessitated a deep understanding of event management,
tracing, and context attachment. Additionally, the selection of an
appropriate database system that could manage structured data,
support high write volumes, and scale effectively was vital to the
project's success. Finally, the user interface design was tackled
with a focus on simplicity and effectiveness, balancing the needs
for both unique features and a streamlined experience.
Through careful consideration of these challenges and the
application of tailored solutions, the MonitorMe app represents a
robust and user-friendly tool that addresses the complex demands of
modern debugging. Its development process is a testament to the
power of innovative thinking, technical expertise, and a commitment
to delivering a product that meets the evolving needs of developers
and users alike.
7. Key Use Cases of MonitorMe
7.1 Detecting Service Delay
In an e-commerce application like MyPetShop, ensuring a smooth
checkout process is vital for customer satisfaction. However, a
delay in the payment service can significantly hamper the user
experience. Let's explore how MonitorMe can address this issue:
Payment Service is Delayed
A customer experiences a couple of seconds delay at checkout, a scenario that
MonitorMe can quickly diagnose. The MyPetShop developer can search
the spans for the customer's name and find the unusually long span
associated with the delay.
By clicking on the segment ID, they can view the trace closely. The
longest span reveals the duration, a little over 5 seconds, and the
requested URL, indicating the service causing the delay. This allows
the developer to understand the nature of the problem and fix it
promptly, ensuring a seamless checkout process.
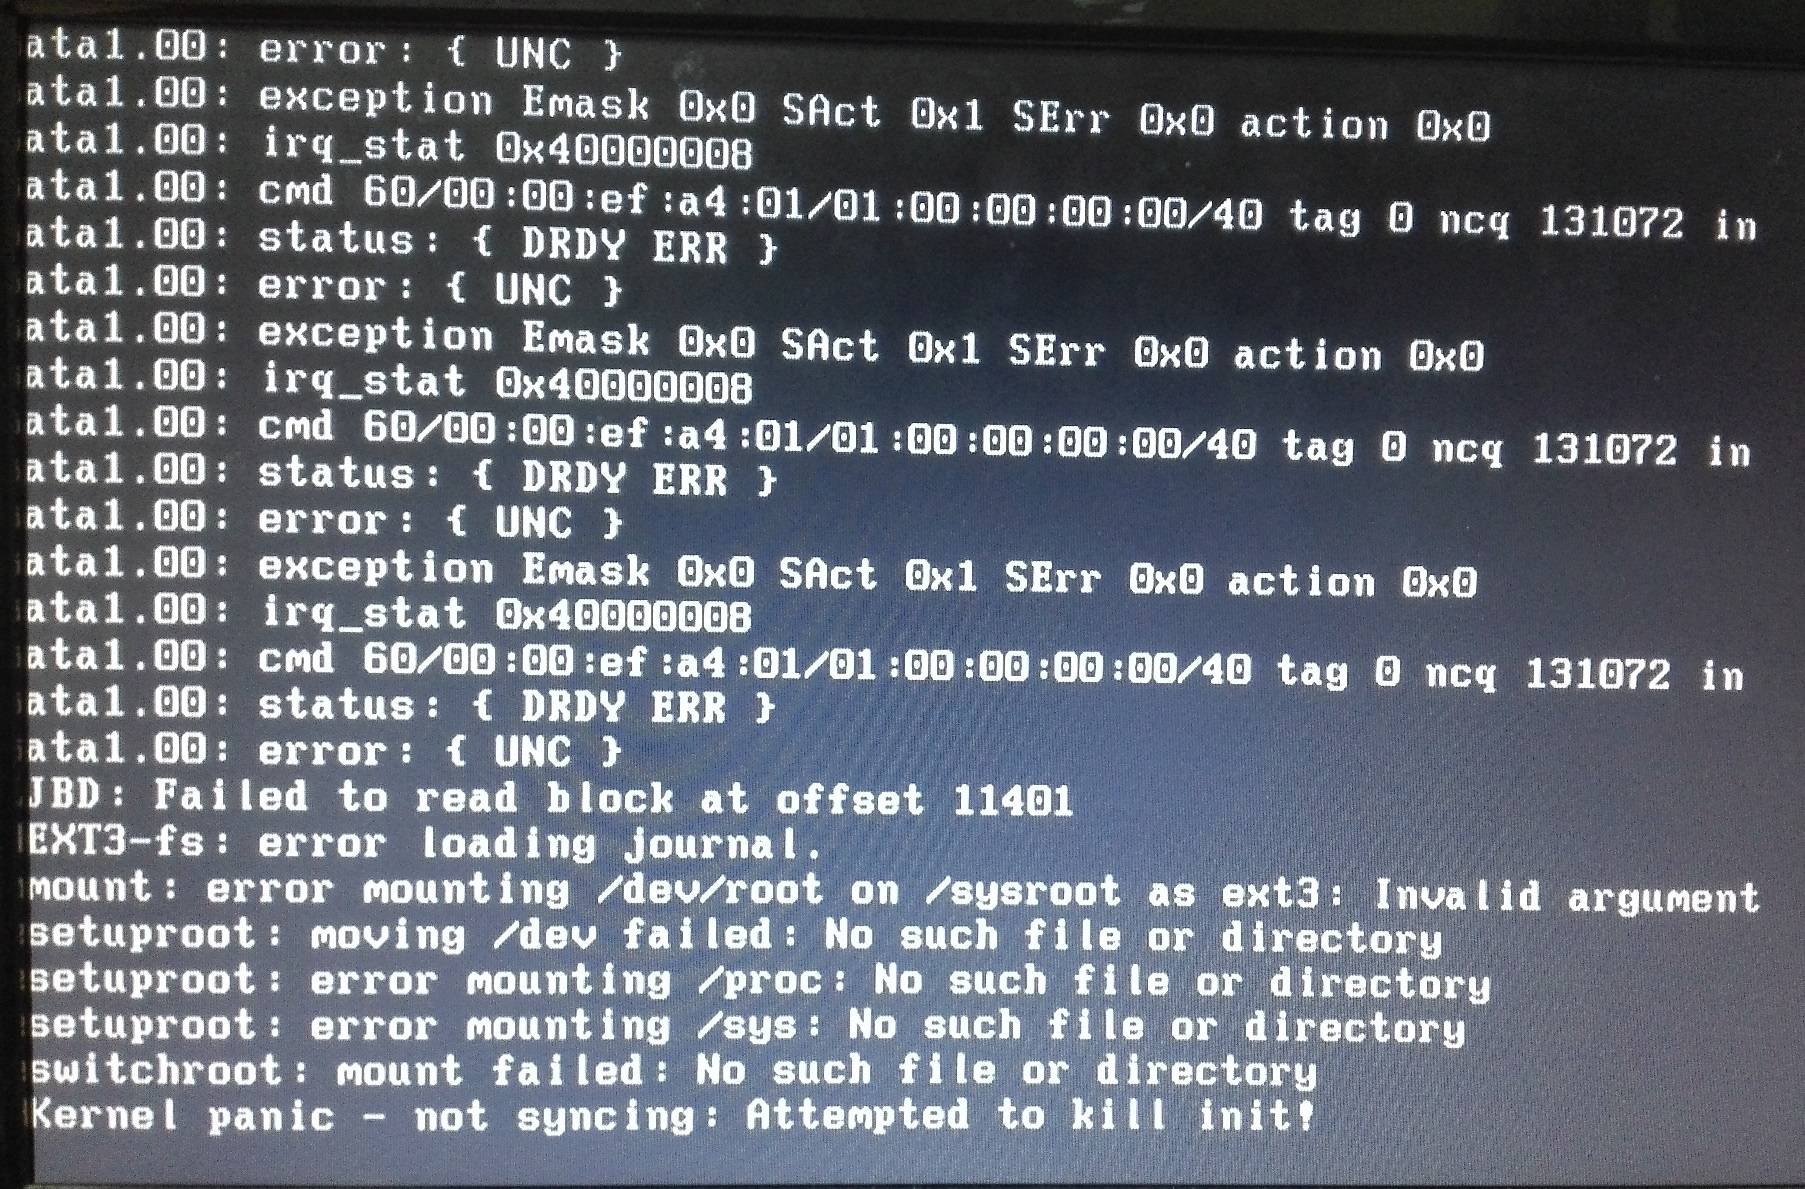
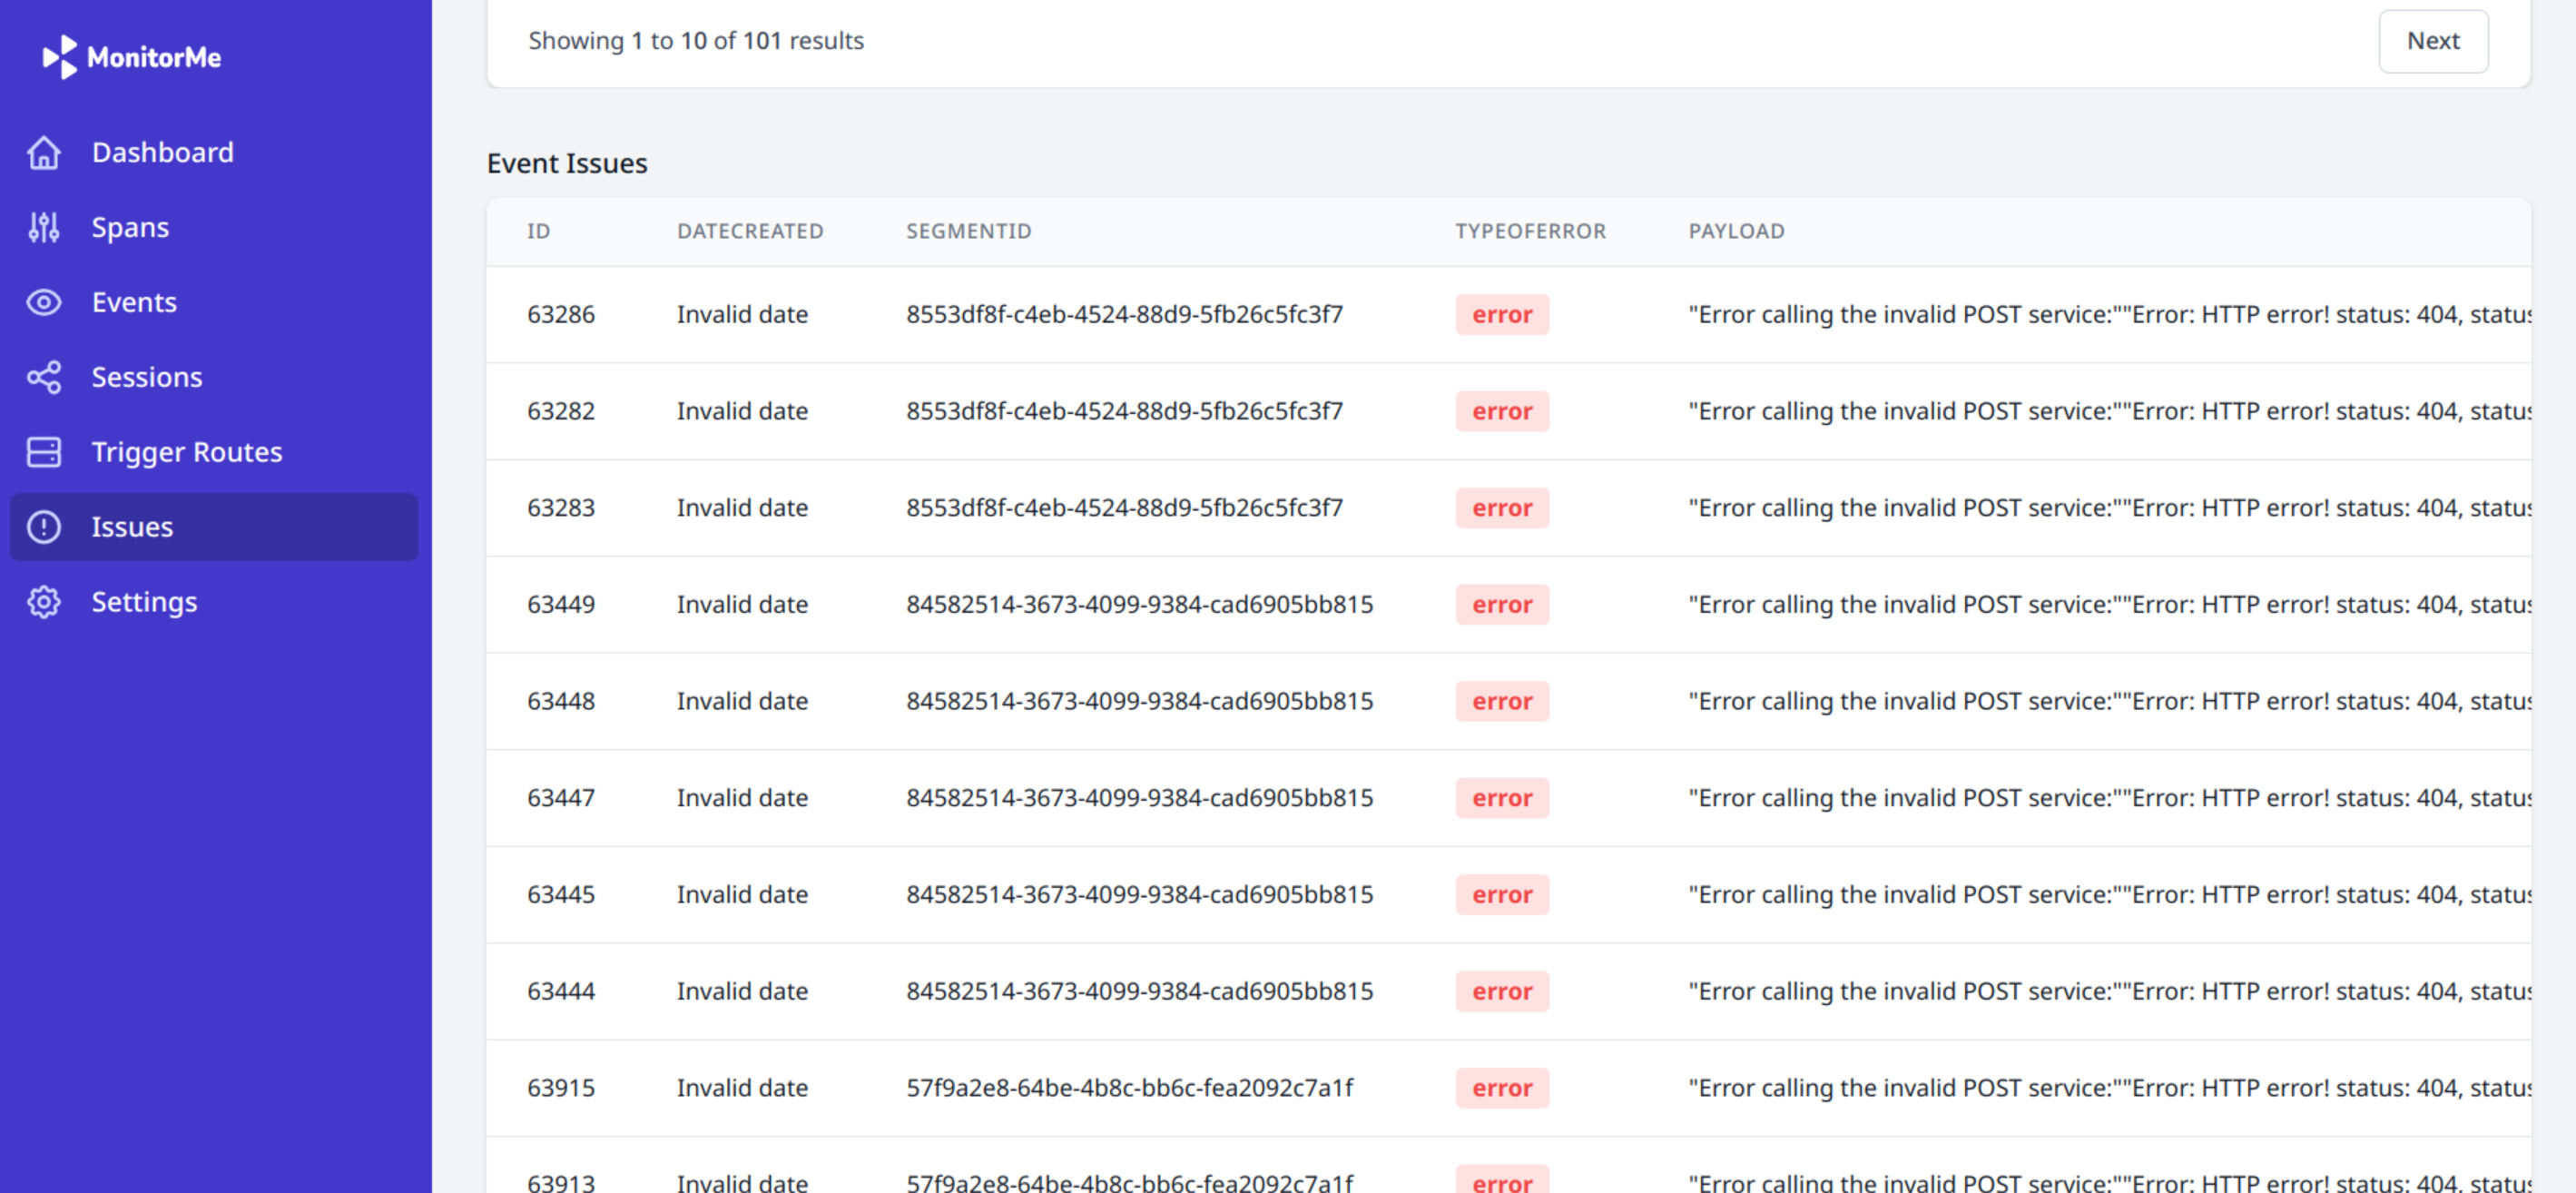
7.2 Detecting Service Outage
Service outages can be catastrophic for an e-commerce platform like MyPetShop. MonitorMe offers
powerful tools to detect and resolve these outages, particularly during critical moments like the
checkout process—when the application fails just as the customer is ready and eager to place an
order.
Shipping Service is Down
Similar to the example provided, if a customer faces an error at
checkout and the order doesn't go through due to the shipping
service being down, MonitorMe can make the debugging process faster
and more predictable.
Once the MyPetShop developer receives the complaint, they can
immediately look for a matching span by filtering for spans after
the error's occurrence time and looking for a span with a 400 or 500
status code. Inspecting the request data helps match the customer
email from the complaint and identify the correct span.
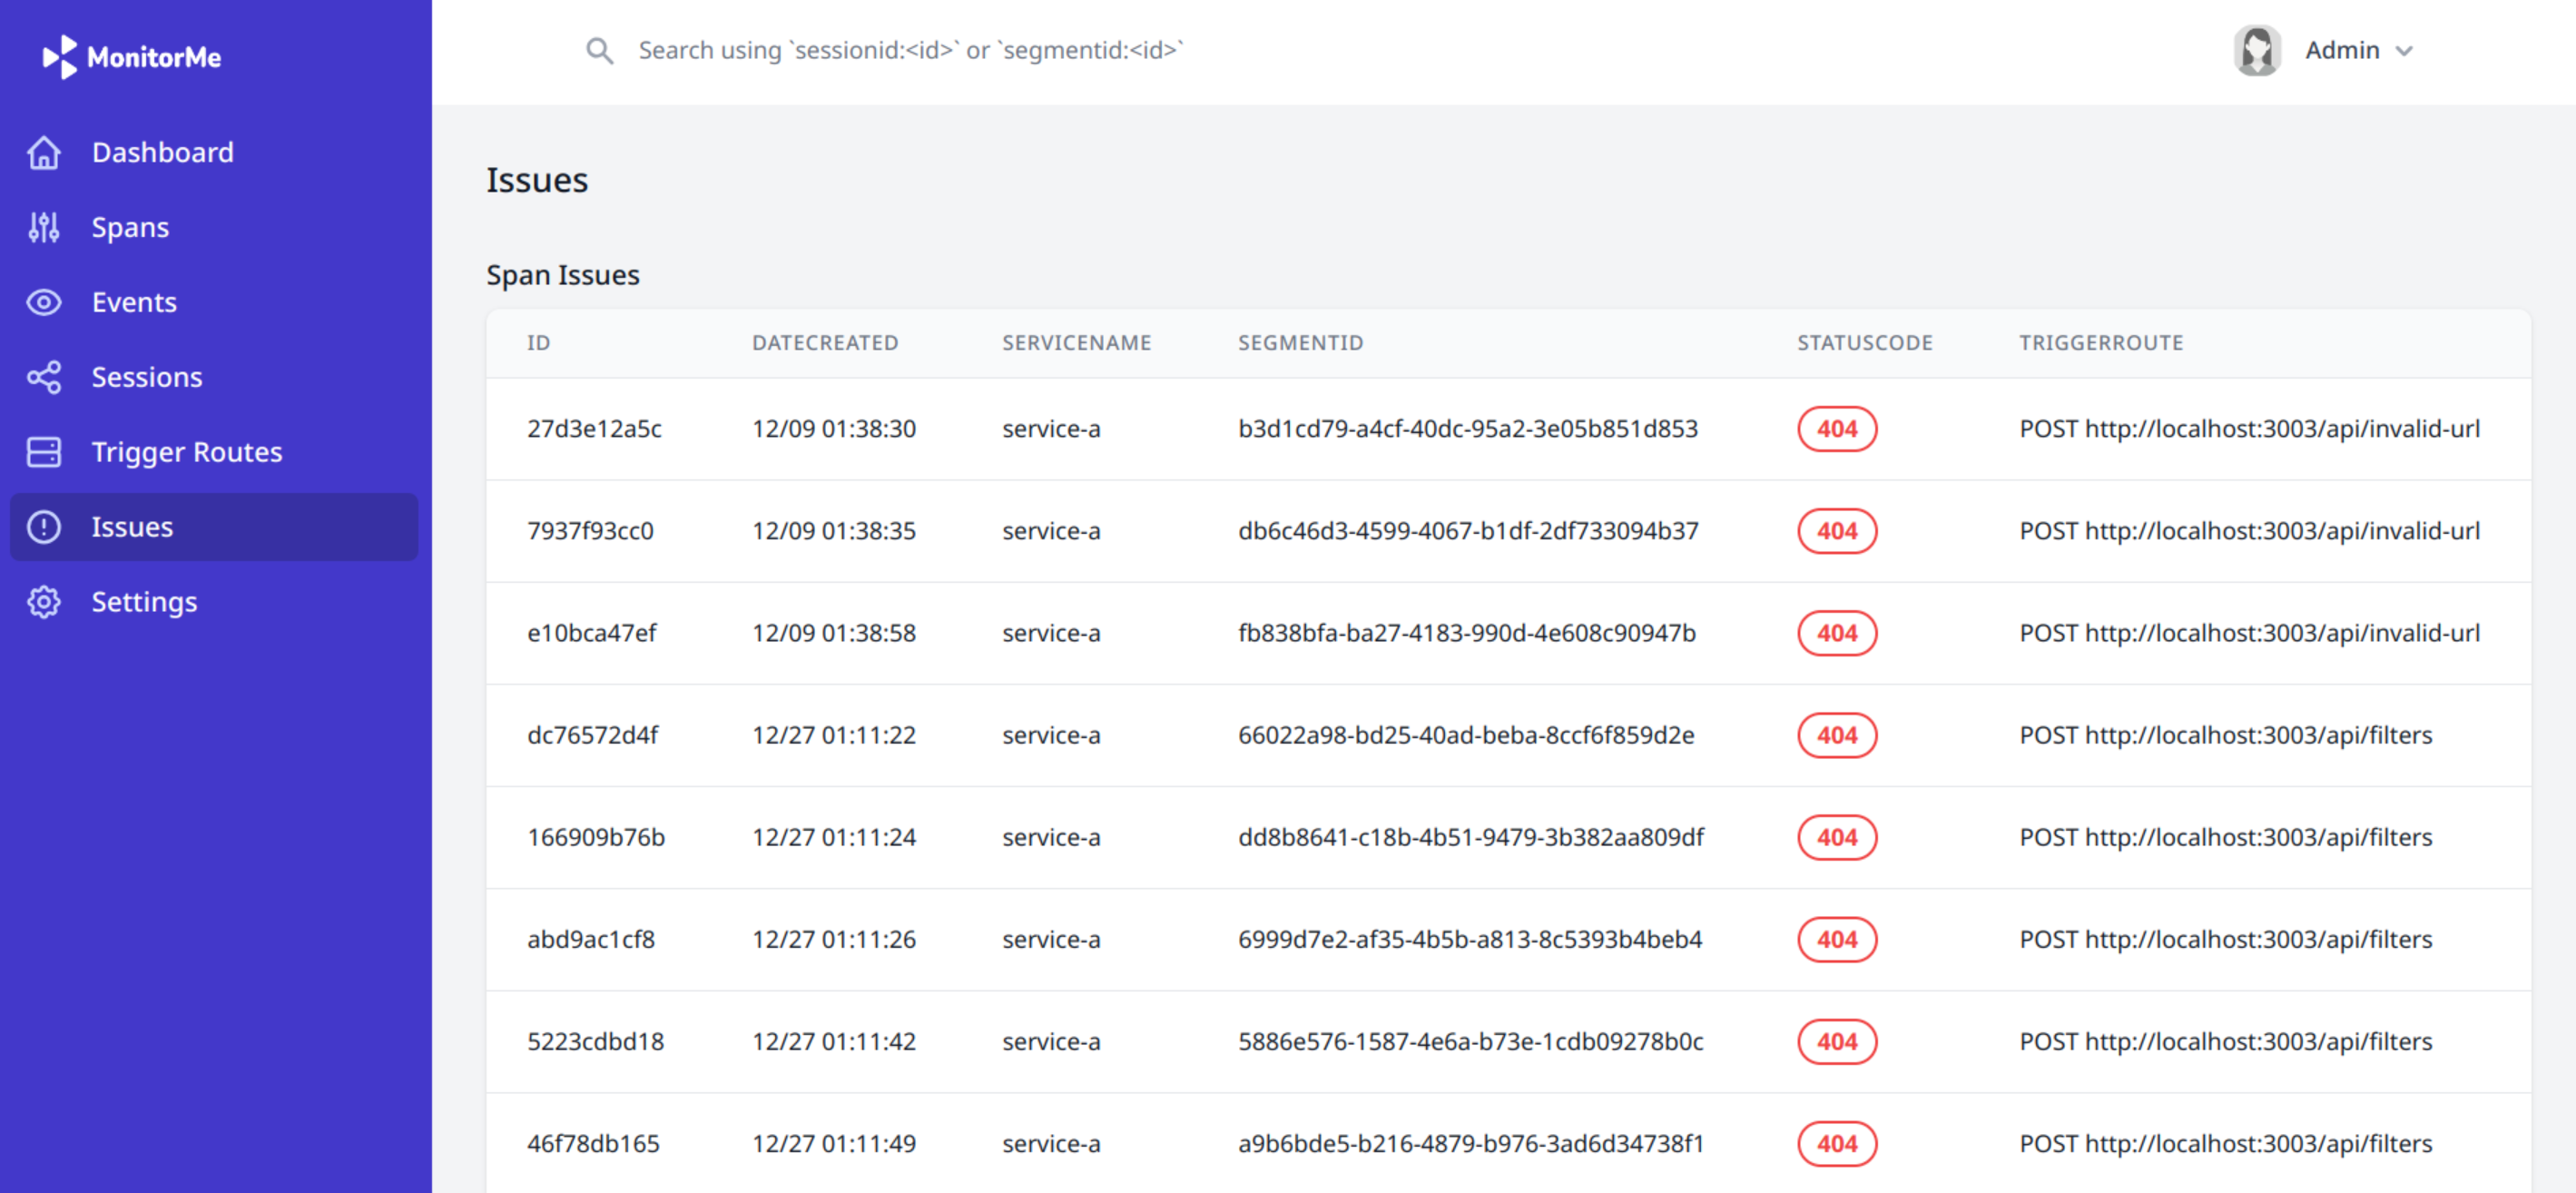
Upon finding the span, clicking on the segment ID provides a better
picture, showing the trace containing that span and all other spans
in that trace. The last span in the trace, having a 500 status code,
is the likely source of the problem.
Clicking on the last span reveals it refers to the shipping service.
The developer can then SSH into the compute hosting the shipping
service and fix it, thereby resolving the outage and restoring the
functionality.
In conclusion, we can say that MonitorMe's capabilities in detecting
service delays and outages are crucial for maintaining a robust and
responsive e-commerce application or any other critical web service
for that matter. By providing detailed insights into the causes of
delays and outages, MonitorMe enables swift troubleshooting and
restoration of services. The real-world application of these
features to MyPetShop's checkout process demonstrates the potential
of MonitorMe to enhance user experience and ensure uninterrupted
operations. Whether it's identifying a delay in payment processing
or resolving a shipping service outage, MonitorMe proves to be an
invaluable tool in managing the complex, interconnected services of
modern e-commerce platforms.
8. Installing MonitorMe
8.1 Installing Server Observability Components
To install the server observability components for MonitorMe, follow
these four steps:
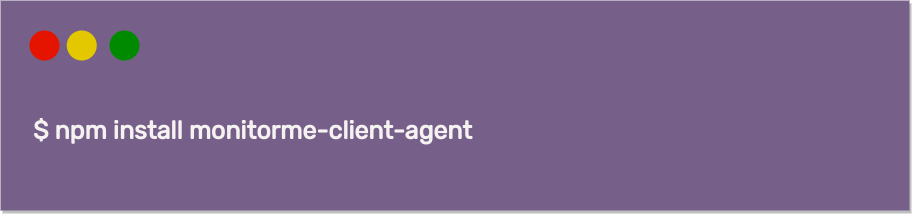
-
Install the Agent: Use npm to install the
"monitorme-client-agent" on each service that communicates with
another service.
-
Update Configuration File: Modify the
configuration file provided by the "monitorme-server-agent"
package. Set the
serviceName to the name of the
service you're instrumenting, update dbOptions to
true if the service uses any of the listed databases,
and change the endpoint property to point to
MonitorMe's API server.
-
Import Custom Baggage: Import the
customBaggage from the "monitorme-server-agent"
package into the server startup file like
index.js and use it as middleware.
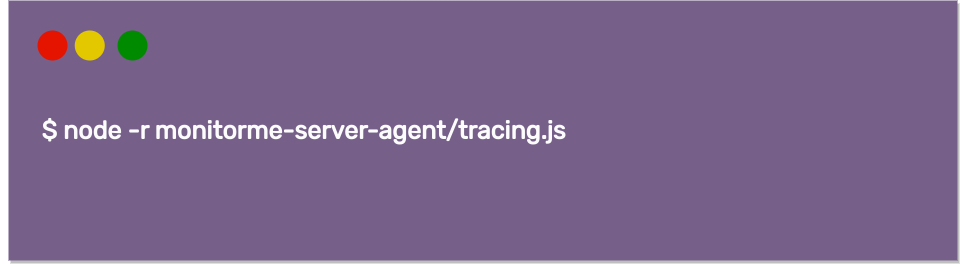
-
Update Start Script: Modify the server's start
script to initiate the
tracing.js
file before the main startup file, e.g., index.js.
Use the command
node -r monitorme-server-agent/tracing.js followed by
the name of the server startup file.
8.2 Setting up Client Observability Features
Setting up client observability features in MonitorMe involves three
steps:
-
Install the Client Agent: Install the
"monitorme-client-agent" with npm on the client.
-
Update Configuration File: Change the
configuration file provided by the "monitorme-client-agent"
package. Alter the
endpoint property to point to
MonitorMe's API server.
-
Import and Start Recorder: Import the
Recorder object from the client-agent into the
index.js file (in the client) and initiate the
Recorder by calling the
init
method.
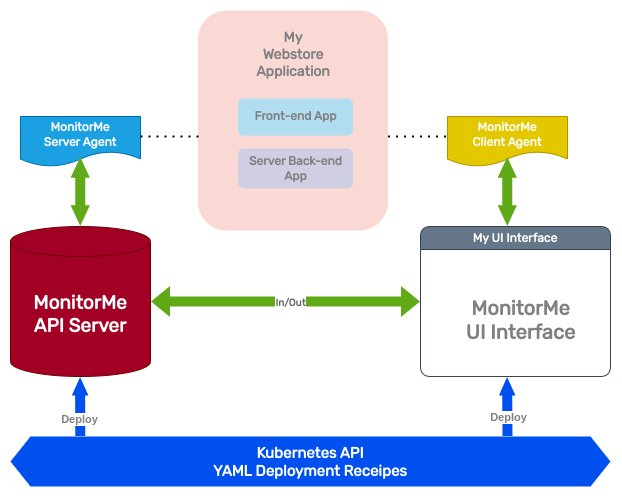
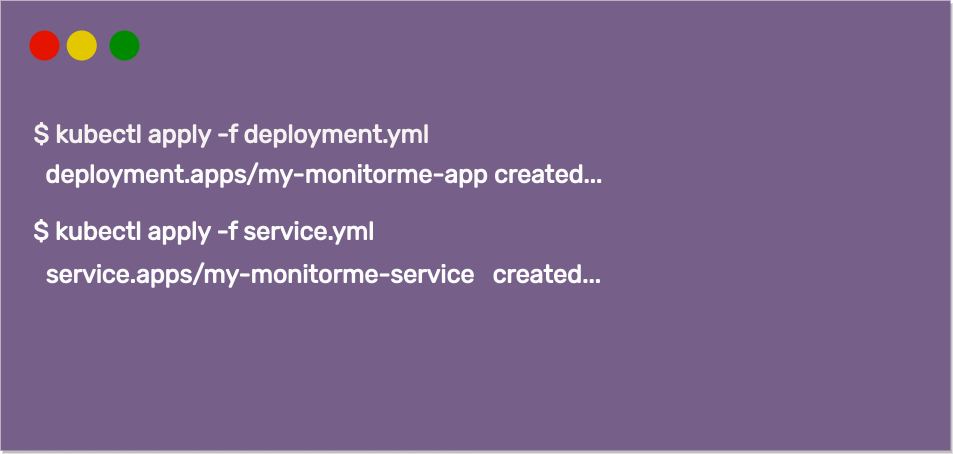
8.3 Installing the Visualization Dashboard with Kubernetes
To deploy MonitorMe's visualization dashboard:
-
Download Files: Download the Kubernetes
configuration files (e.g., deployment.yml, service.yml) and
data.sql file from MonitorMe's "deploy" repository.
-
Apply Kubernetes Configuration: Use
kubectl apply -f deployment.yml -f service.yml
to deploy the MonitorMe components in your Kubernetes cluster.
This command will create deployments for the UI, a Cassandra
instance, scheduled maintenance tasks, and an API server, along
with their respective services to expose them.
-
Confirm Endpoint Property: Ensure the endpoint
property in both "monitorme-server-agent" and
"monitorme-client-agent" configurations points to the service
domain within your Kubernetes cluster.
Following these steps will set up MonitorMe's visualization
dashboard on Kubernetes, enabling it to provide insights into
service delays and outages, thus improving the robustness and
responsiveness of applications like MyPetShop or any other service
utilizing complex, interconnected components.
9. Future Directions and Roadmap
In conclusion, MonitorMe stands out as a pioneering open-source
full-stack observability solution, ingeniously aggregating traces
and session recordings within a unified interface. Our commitment to
enhancing security and functionality is evidenced by the seamless
integration of user authentication—a feature we take great pride in.
However, our vision for MonitorMe extends beyond its current
capabilities. We are keenly aware of the potential enhancements that
could fortify our offering:
-
Improve Options for Scaling: Recognizing the
dynamic nature of data growth, we plan to introduce sophisticated
tools designed to facilitate the seamless expansion of the
database cluster, thereby enhancing our platform's scalability and
performance.
-
Support More Languages on the Back-End: While
OpenTelemetry's current support extends to JS, Go, Python, Java,
and .NET, we are committed to broadening our back-end language
support. This expansion will cater to a more diverse development
community, accommodating the integration of additional programming
languages into our observability tool.
Looking ahead, the trajectory for MonitorMe is filled with
innovation and enhancements aimed at addressing the complex and
evolving demands of modern application monitoring and observability.
We are dedicated to continuous improvement, striving to not only
meet but exceed the expectations of our users. The journey ahead is
exciting, and we invite you to join us as we pave the way toward a
more observable and secure digital future.